Building activity remains flat: pipeline still soft
As befits its status as the major private sector driver of the domestic economy, housing is both simple and complex at the same time. Simple in that the linear supply chain for new housing is well understood: demand, approvals, commencements, completions. Complex, because there are as many variants and sub-measures of activity for the sector as there are building products. And that is without mentioning the differences between the states.
So, there is an eternal hunt for meaningful, insightful and helpful predictive data that can assist in explaining this complex sector. That is why we focus a lot of our attention onto dwelling approvals: it’s the start of the construction pipeline. To read the latest on approvals see later in this edition of Stats Count.
One measure that is valuable to consider is actual building activity. That is, the building work that has commenced and has been completed over a period.
The chart below shows Houses (the free-standing favourites of the Australian housing economy), at various stages of development.
Fig.1

The blue line shows the number of houses on which building work commenced in the June quarter was 25,715, a drop of 10.6% on the prior quarter and 16.4% lower than in JQ’18.
In green, we can see the number of houses in construction, which means those that commenced in the quarter plus those that were commenced in prior quarters. Work in progress is another way to think of this measure, which at 59,782 dwellings was down 5.0% on the prior quarter and 15.8% on a year earlier.
Finally, we can see in red, the number of houses upon which work was completed. That measure fell 6.1% on the prior quarter to 28,455 completions and was down 3.4% on the June quarter of 2018.
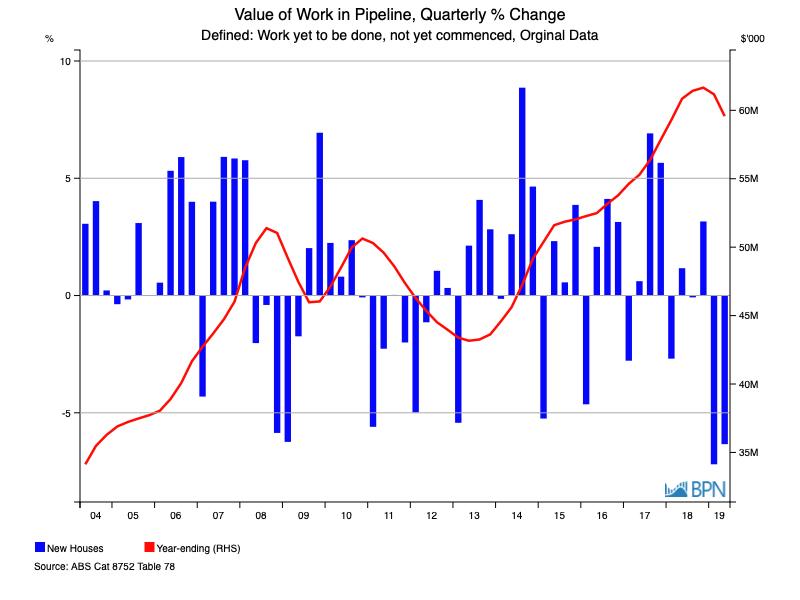
Softness in the housing sector is evident in all phases of the pipeline, and as the chart below shows, is also evident in the value of that work. The total value of building work on new houses in the June quarter was down 6.3% to $13.740 billion, dipping to $59.569 billion on an annualised basis.
Fig.2
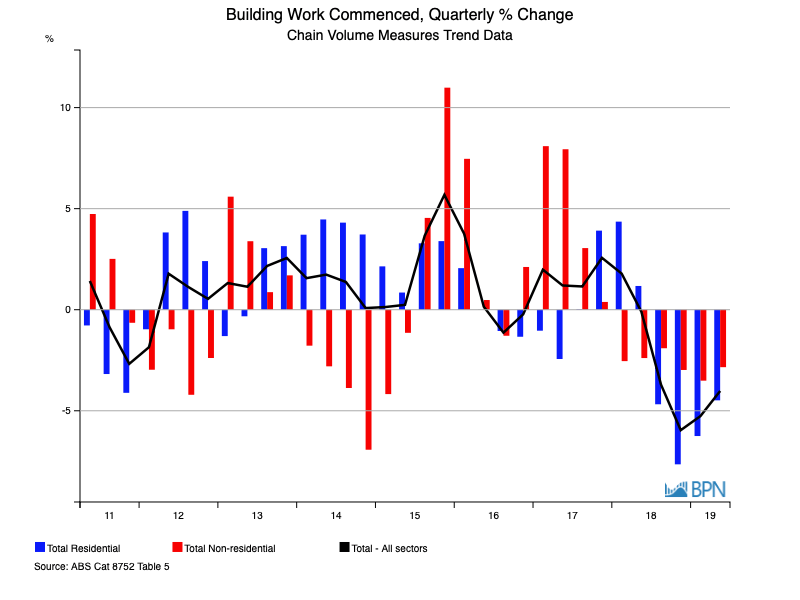
It is worthwhile examining Australia’s total building activity, to see where the work lies across the vast and total building sector. Here we consider the building work that commenced in the June quarter, at an aggregate level in the residential sector (shown in blue) and the non-residential sector (show in red).
It is easily observed that by the June quarter of 2019, the housing sector had experienced four successive quarters in which the value of commenced work fell. Down 4.5% in the June quarter, it was also the fourth successive quarter that the housing sector declined at a faster rate than the non-housing sector, which declined 2.8% over the same period.
However, just as plain is that the declines in the value of work commenced in the non-housing sector have been running for six consecutive quarters.
Fig. 3
Drilling further into the housing sector approvals data demonstrates the number of multi-residential dwellings (especially the high rise element) is down, and as we can see below in red, that was reflected over all four quarters of 2018-19. In the June quarter, the work commenced was valued at $5.879 billion, down 4.3% on the previous quarter.
The blue bar shows that Alterations & Additions commencements also fell, down 3.1% on the prior quarter to $2.014 billion.
Shown on the black line, the total value of residential building work was down 4.6% on the prior quarter, amounting to $8.383 billion.
Fig. 4

Finally, we want to drill into the non-residential sector to see if there are different patterns of growth in the sub-sectors. It is hear we find the one bright spot of the June quarter. Commercial building activity bounced back hard and in the June quarter was 13.2% higher than the prior quarter, with activity valued at $3.629 billion. On the flipside, industrial buildings continued their roller coaster ride, with the value of work commencing falling 1.9% and totalling $1.563 billion.
Fig. 5

To go straight to the dashboard and take a closer look at the data, click here.
Coupled with approvals data, this information provides further insight into what is being built in Australia, what it is worth and even how quickly we are getting it all built.
This article was written by Jim Houghton for FWPA’s latest StatisticsCount.